#12
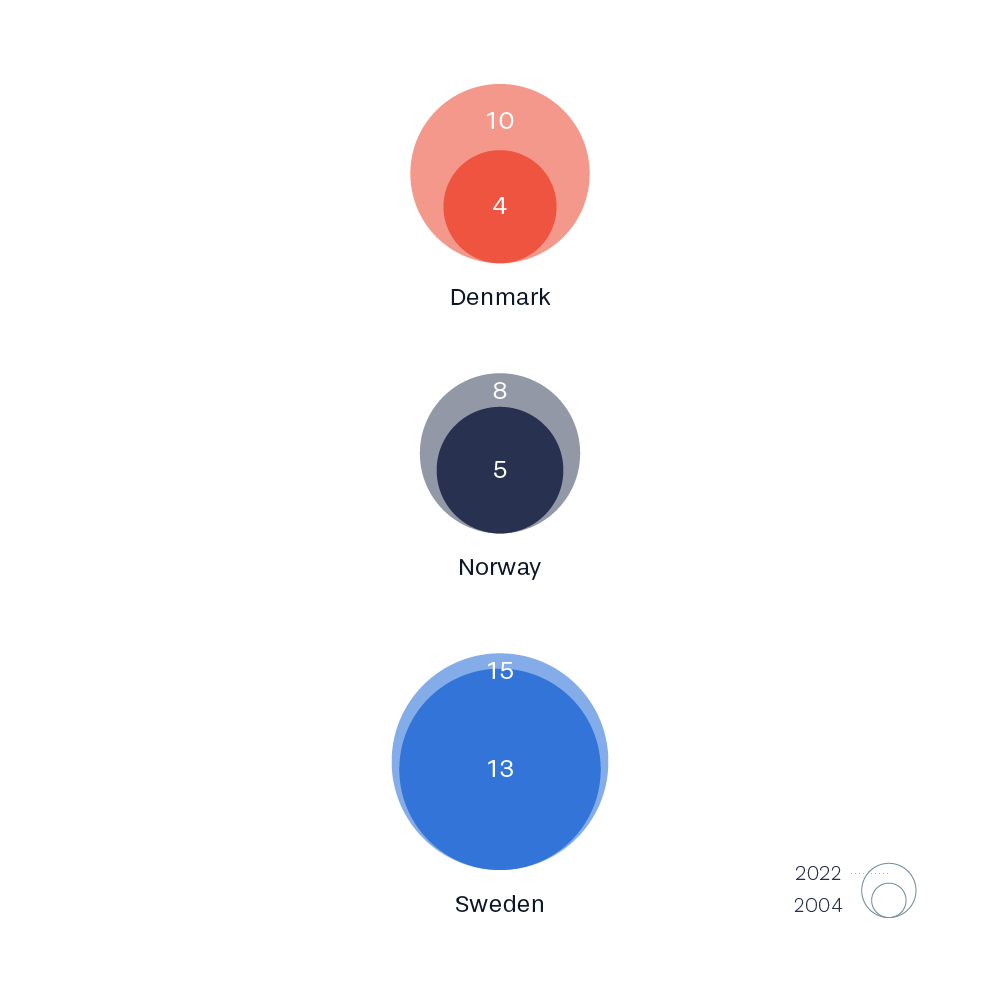
A nested proportional area chart. 2004 is highlighted and nested and the development is visible as the gap between the inner and outer circle.
A nested proportional area chart. 2004 is highlighted and nested and the development is visible as the gap between the inner and outer circle.

