#23
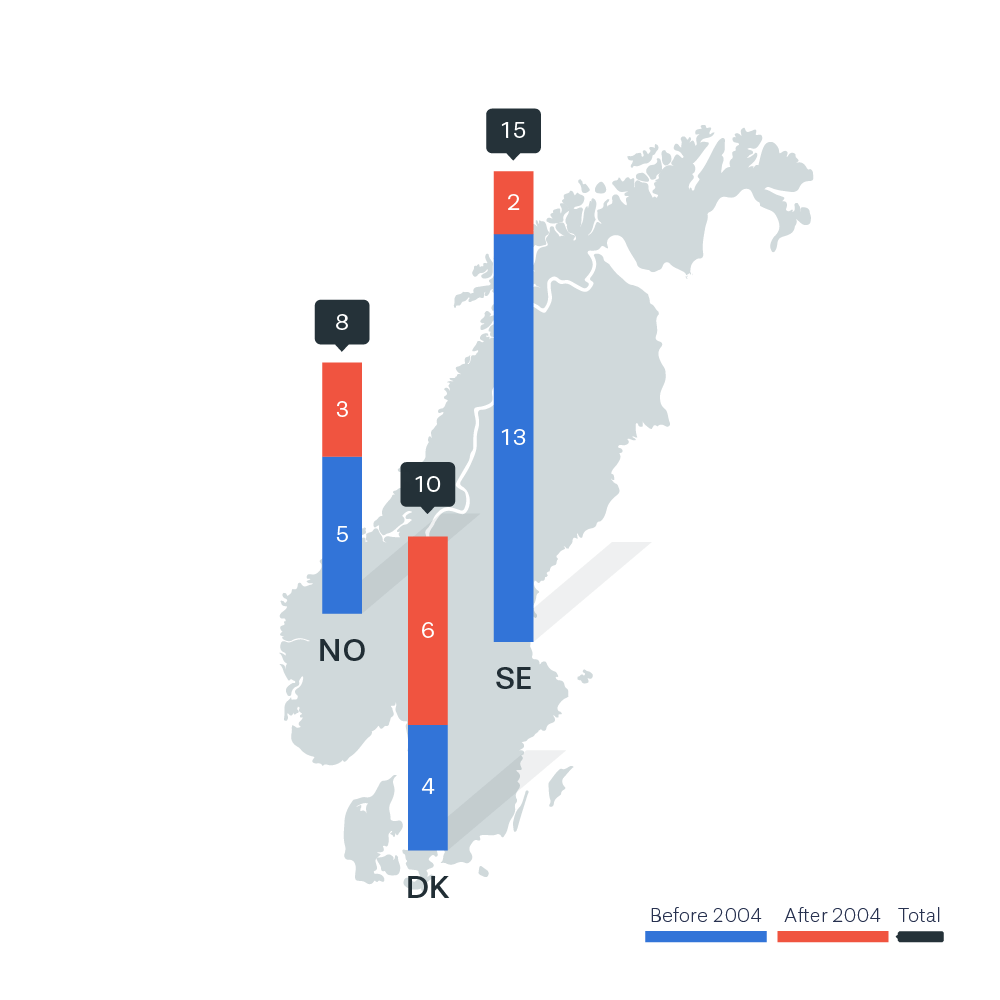
Stacked bar charts on a map of Scandinavia. The fact that each bar is located on the map actually makes it a bit harder to compare the bar heights, which is why values and total values have been added to the visualization.
Stacked bar charts on a map of Scandinavia. The fact that each bar is located on the map actually makes it a bit harder to compare the bar heights, which is why values and total values have been added to the visualization.

