#25
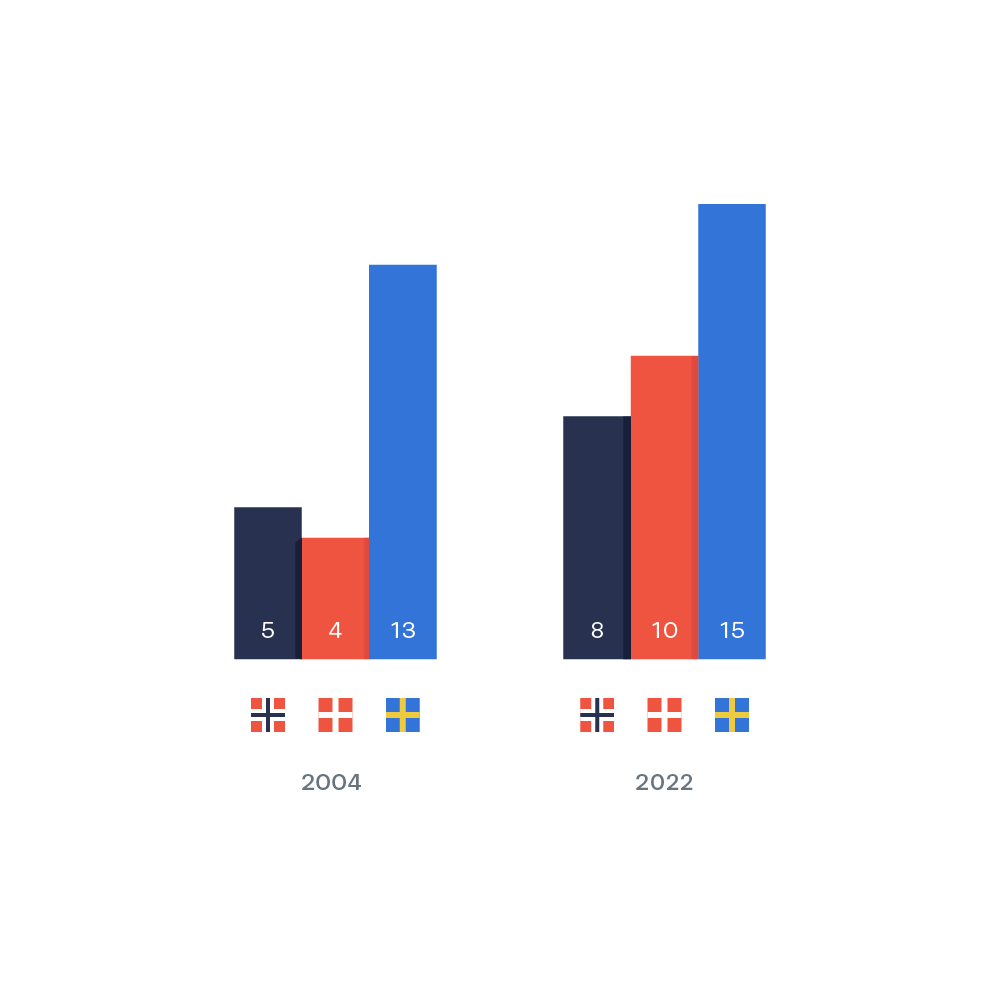
Simple bar chart placed in clusters. The advantage of this type of visualization is the ability to easily compare all values within the dataset.
Simple bar chart placed in clusters. The advantage of this type of visualization is the ability to easily compare all values within the dataset.

