#3
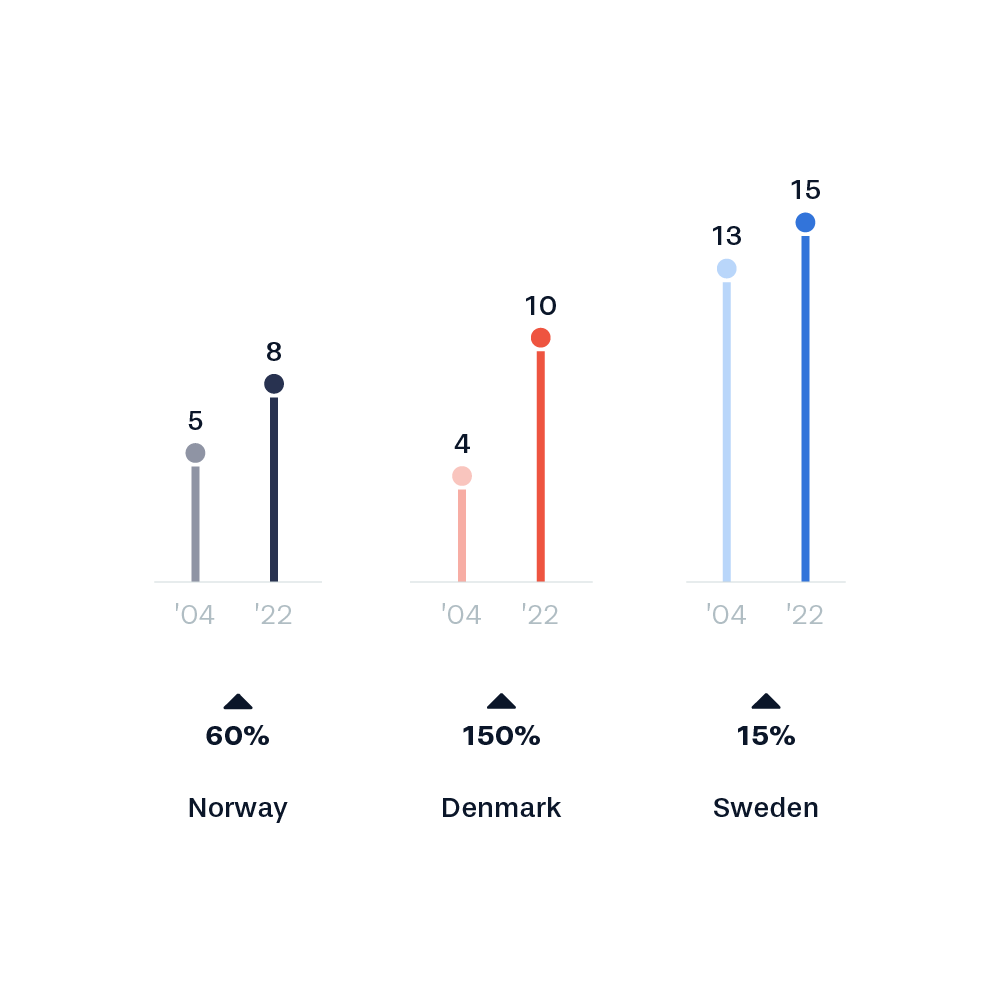
A lollipop chart, which works as a clean and efficient visualization for this dataset. The numbers are indicated above each lollipop, and the axis is omitted as it is not needed. An advantage for this visualization is the ability to compare all numbers across both countries and years.


