#31
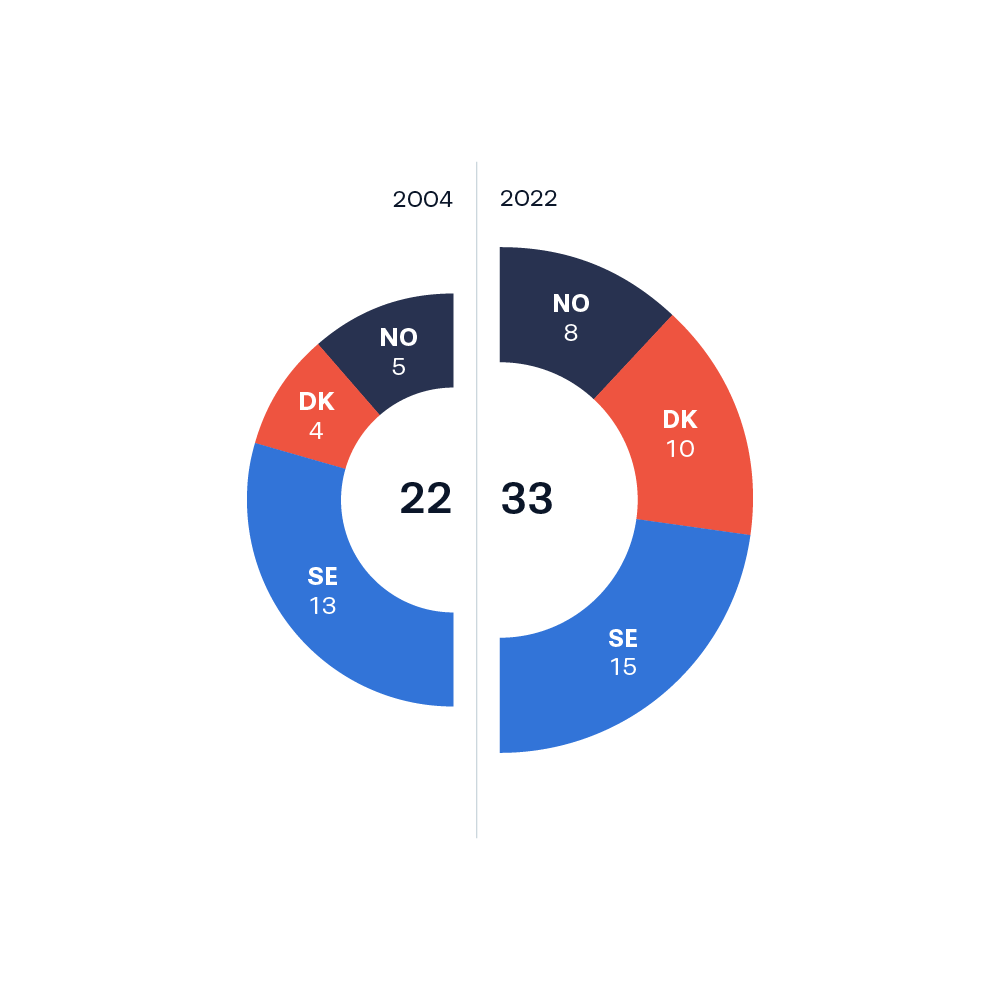
A semicircular donut chart showing the distribution of sites in 2004 and 2022. Furthermore, the total numbers for Scandinavia are visualized by the size of the half donuts.
A semicircular donut chart showing the distribution of sites in 2004 and 2022. Furthermore, the total numbers for Scandinavia are visualized by the size of the half donuts.

