#36
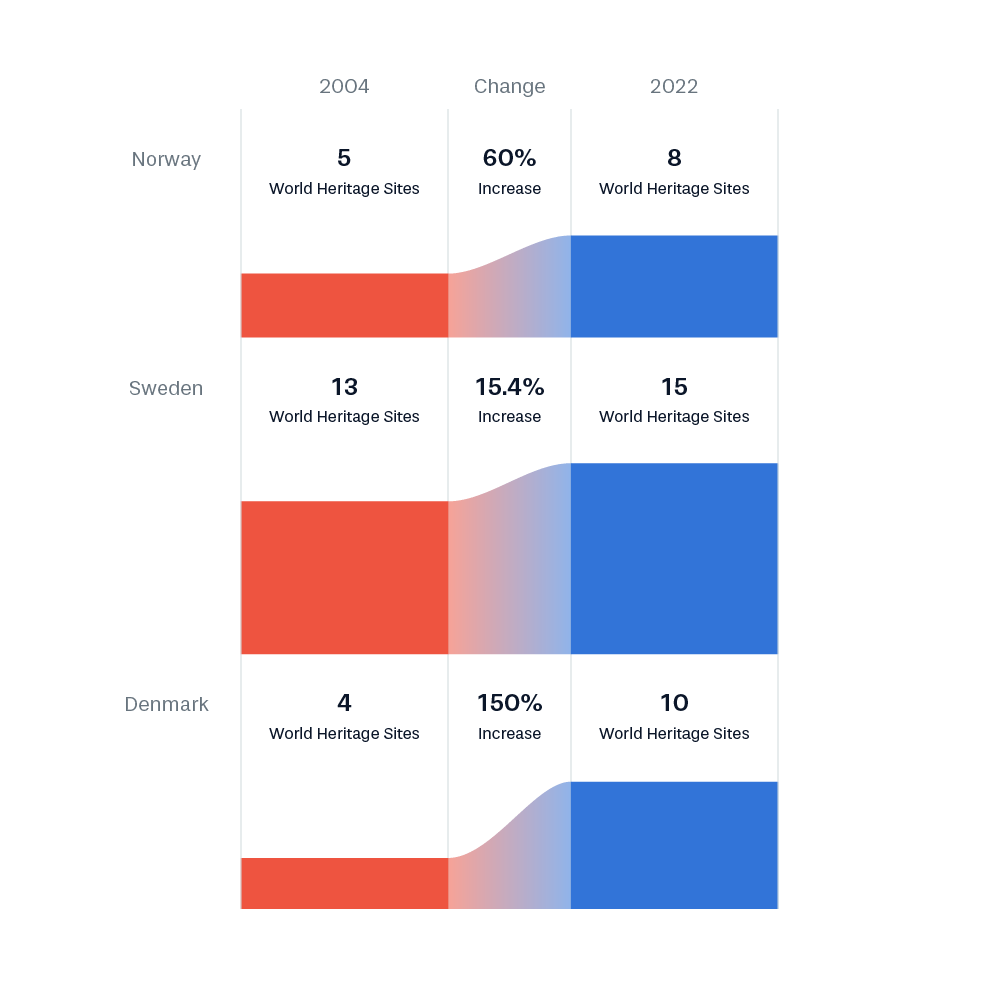
Bar charts are linked visually to highlight the development from 2004 to 2022. The development in percentage is included as this is the main story of this visualization.
Bar charts are linked visually to highlight the development from 2004 to 2022. The development in percentage is included as this is the main story of this visualization.


