#42
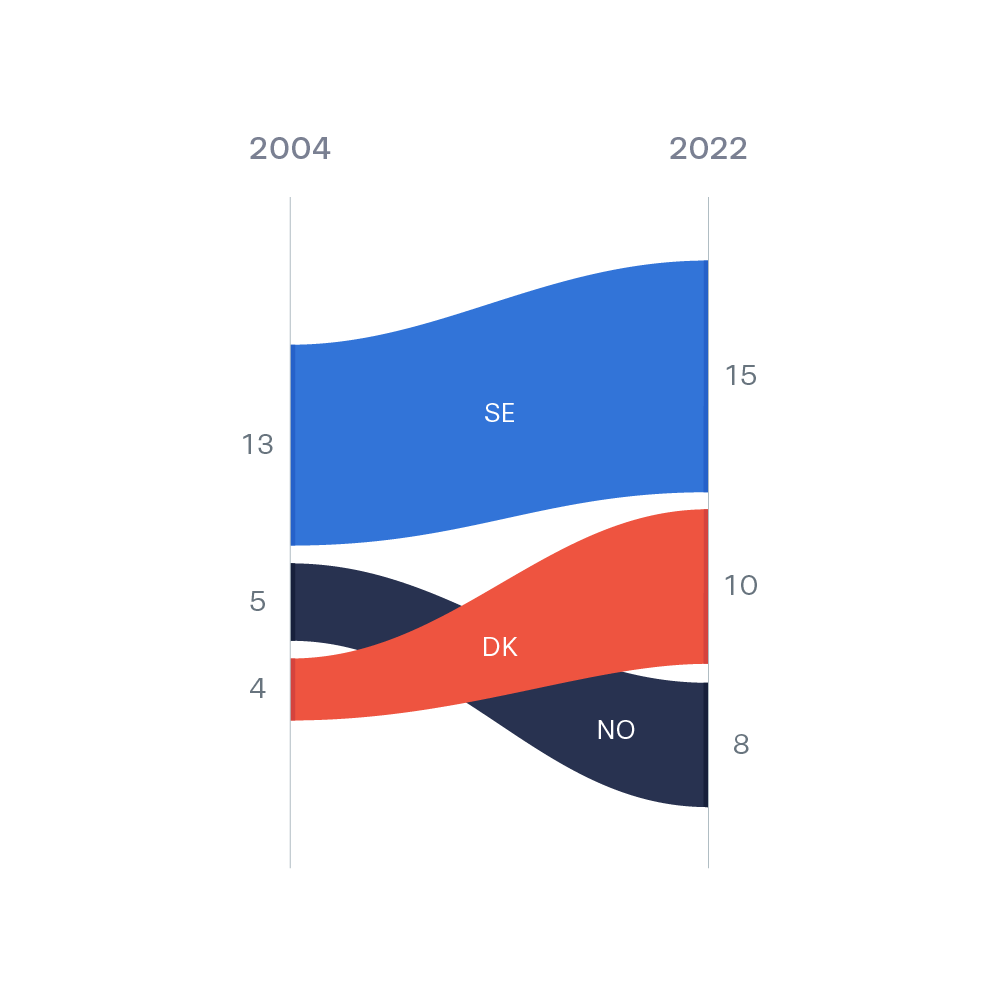
A sorted stream graph. This type of visualization is usually used with more data points for the timeline, but it can also work with less. Because it is sorted, the switch of Denmark and Norway ends up getting a lot of attention.
A sorted stream graph. This type of visualization is usually used with more data points for the timeline, but it can also work with less. Because it is sorted, the switch of Denmark and Norway ends up getting a lot of attention.

