#45
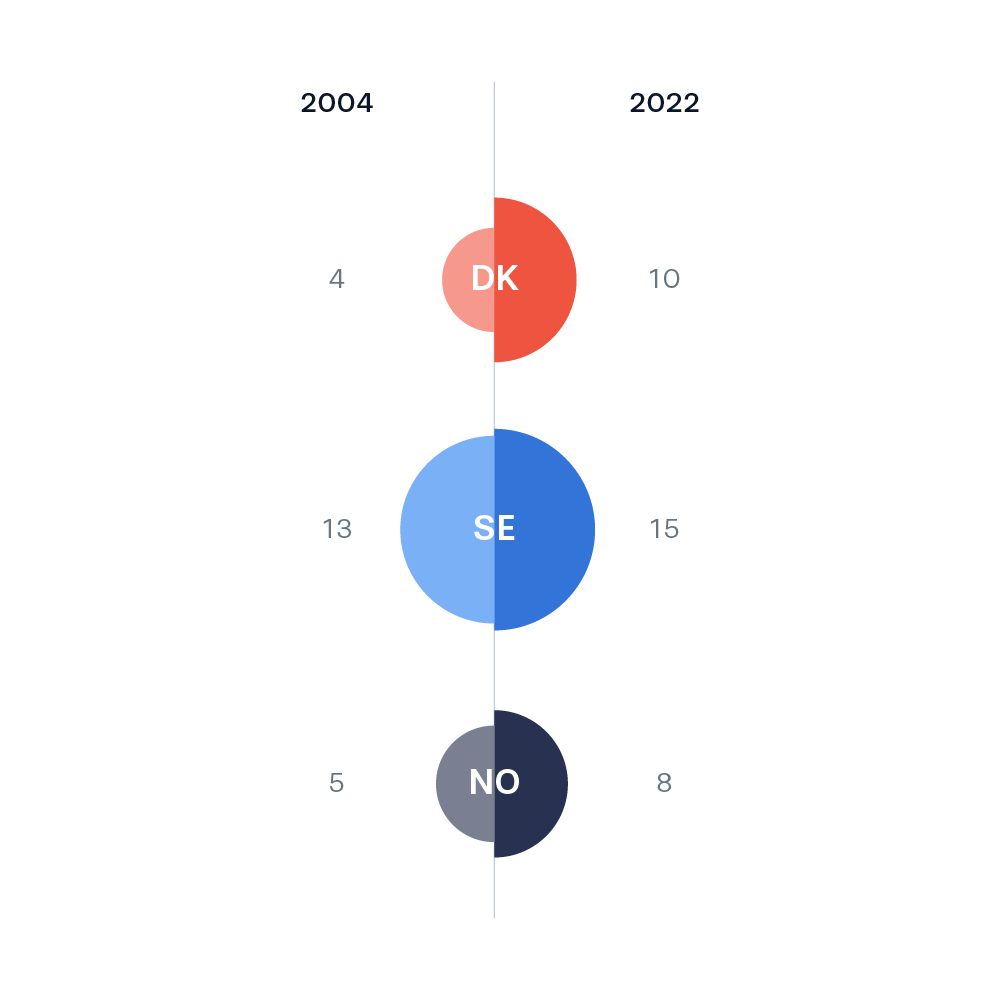
Proportional area chart as half circles, where the left side shows 2004 and the right side 2022. The scale of the half circles is easy to read next to each other but more difficult to read across countries, so the accompanying numbers are necessary here for readability.

