by Ferdio
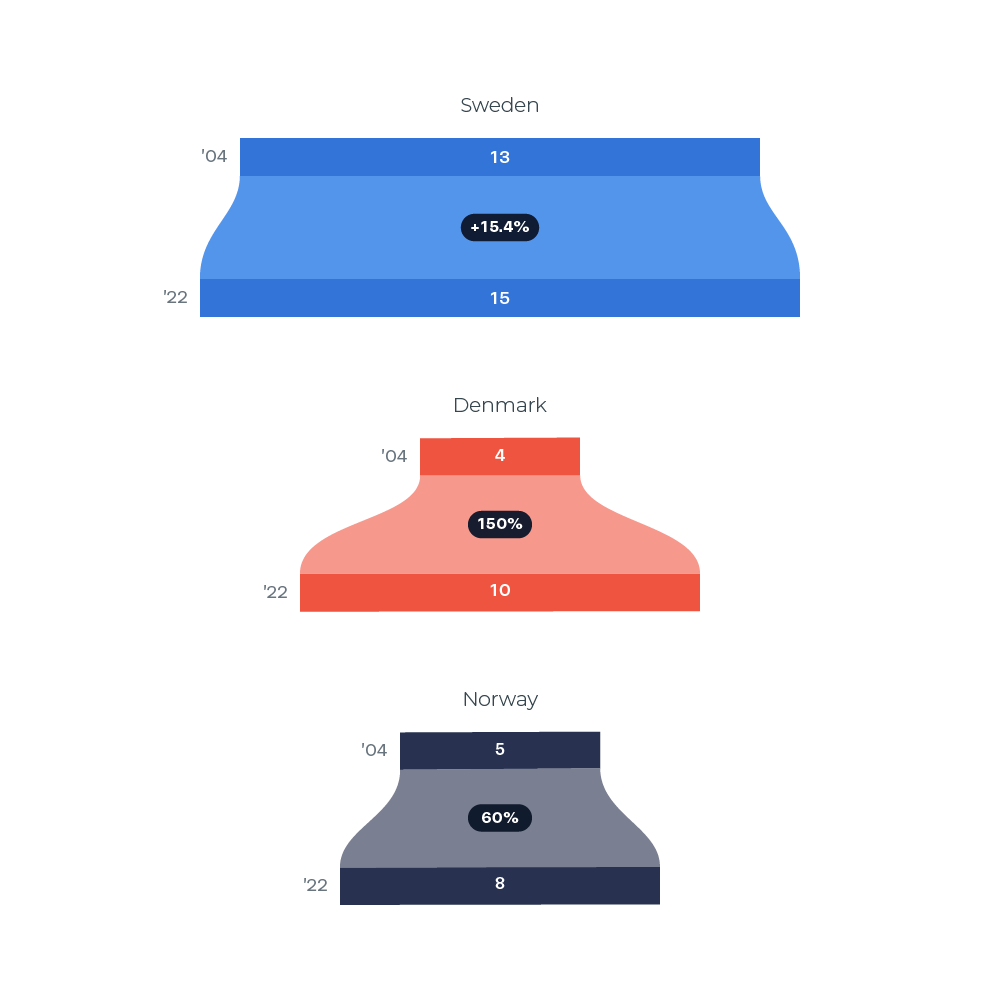
A funnel-like data visualization. A bar chart where the bars have been center-aligned and connected to highlight the change in percentage.