#56
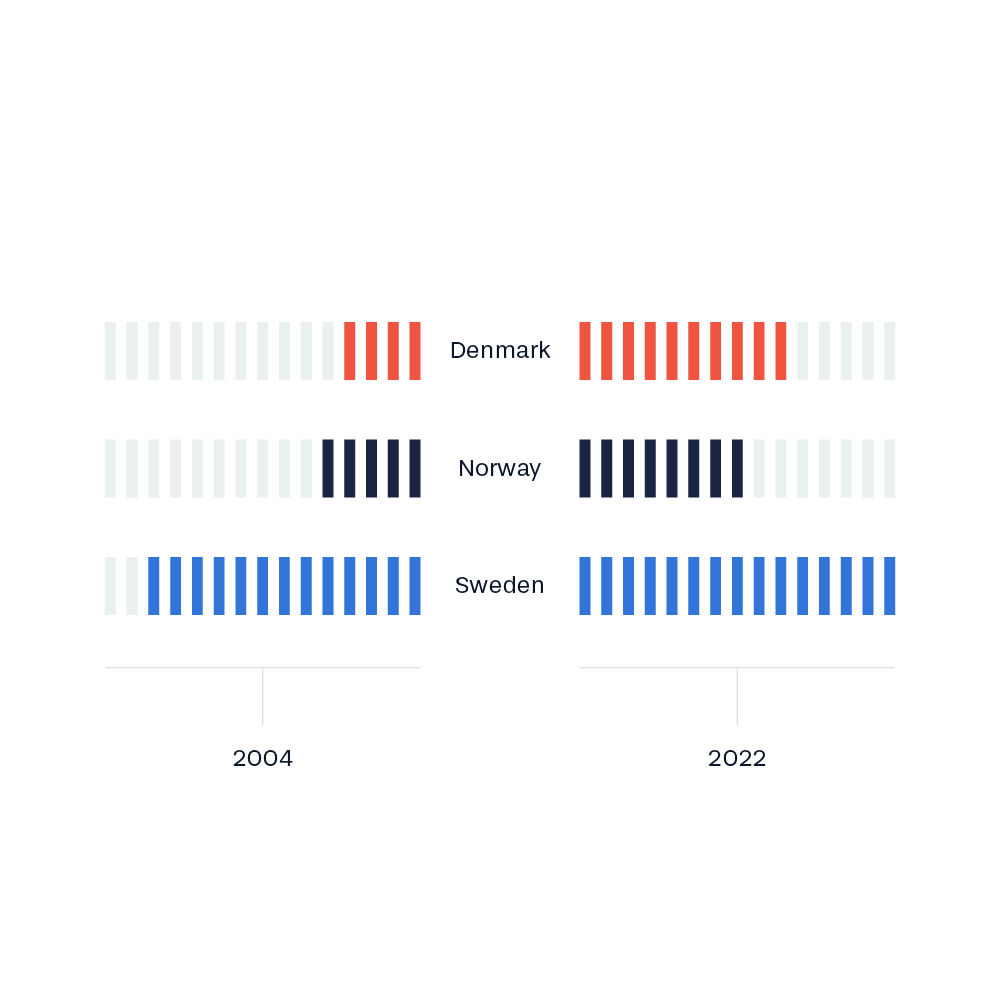
Distribution in 2004 vs 2022 in a butterfly-like chart. The chart plots the number of World Heritage sites as lines in two horizontal bars with the same X-axis in the center.
Distribution in 2004 vs 2022 in a butterfly-like chart. The chart plots the number of World Heritage sites as lines in two horizontal bars with the same X-axis in the center.

