#60
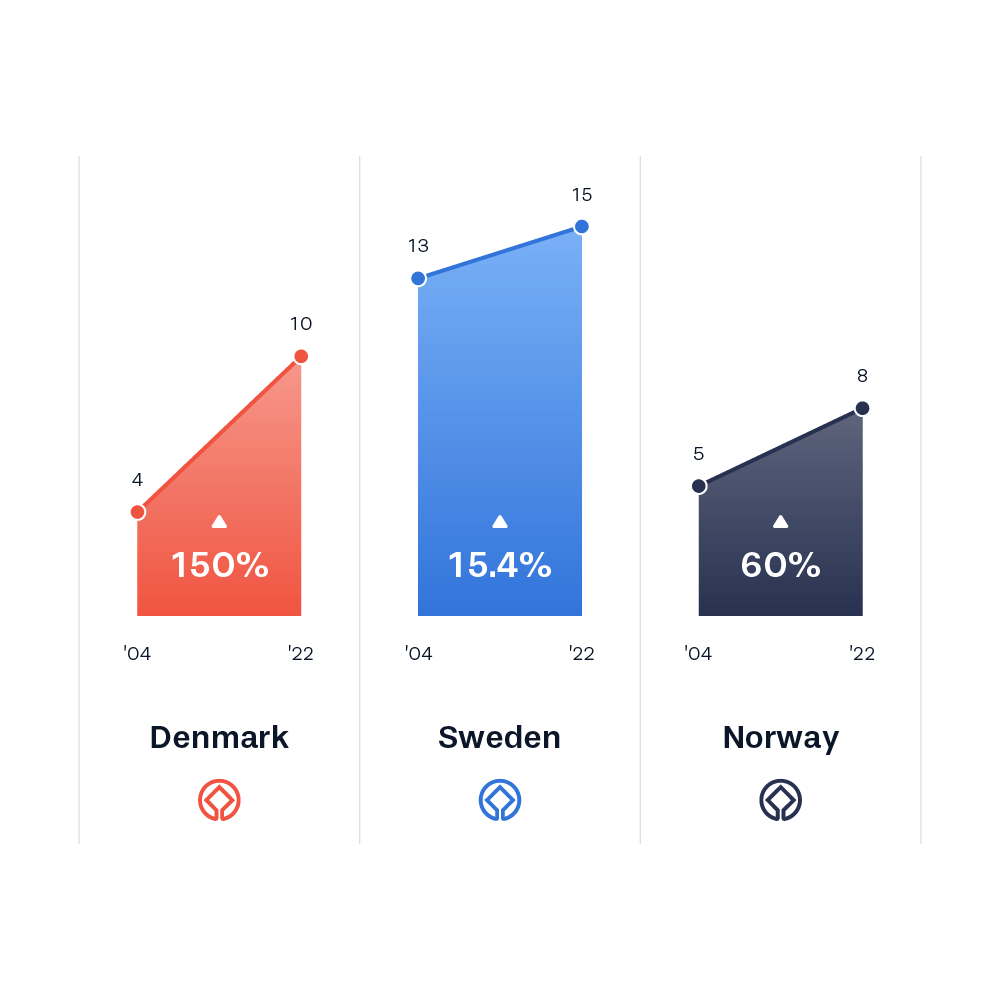
The visualization is a combination of a line graphs and bar charts. The upper left corner of the bar represents the height for the 2004 numbers and the current number for 2022 is in the right corner. The development in percentage is highlighted as the most important metric in this visualization.


