#68
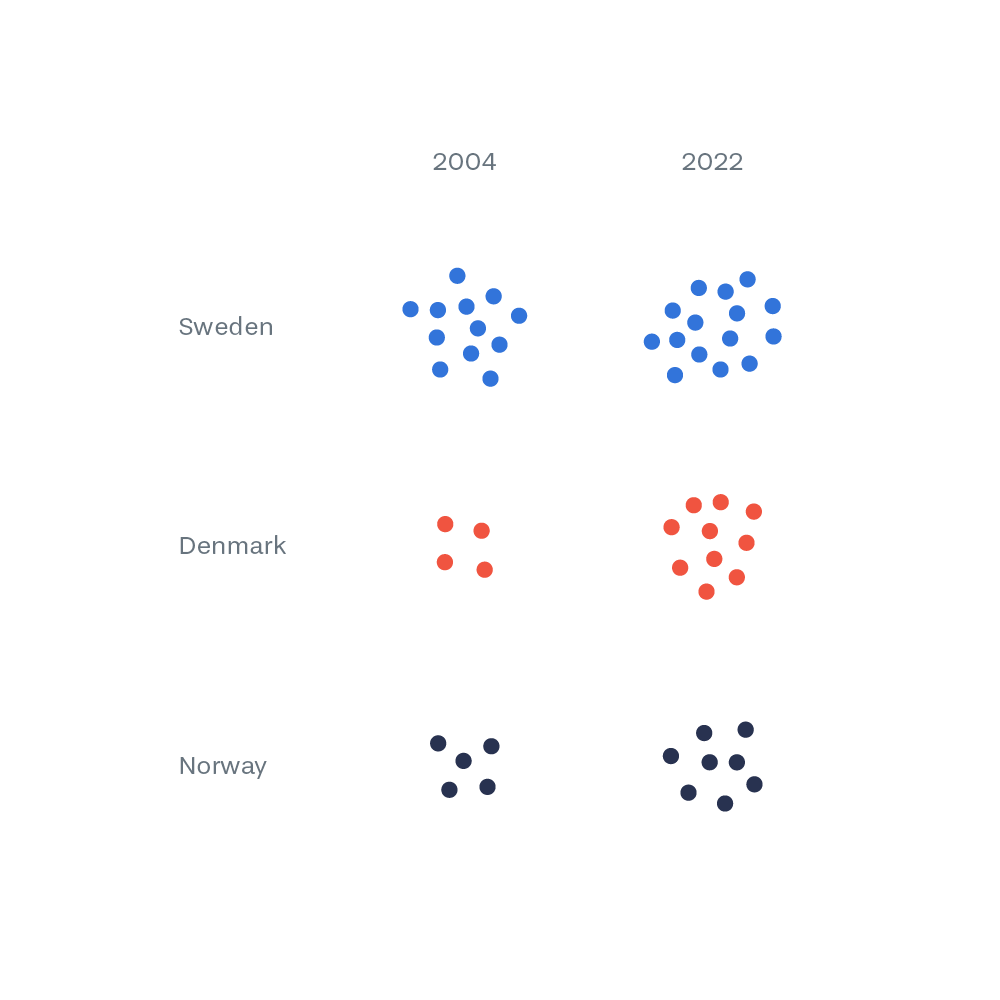
Each dot represents a World Heritage site. The dots are placed in groups in random formations, and it might be difficult to differentiate 8 from 10, so the visualization shows the distribution more roughly.
Each dot represents a World Heritage site. The dots are placed in groups in random formations, and it might be difficult to differentiate 8 from 10, so the visualization shows the distribution more roughly.

