#70
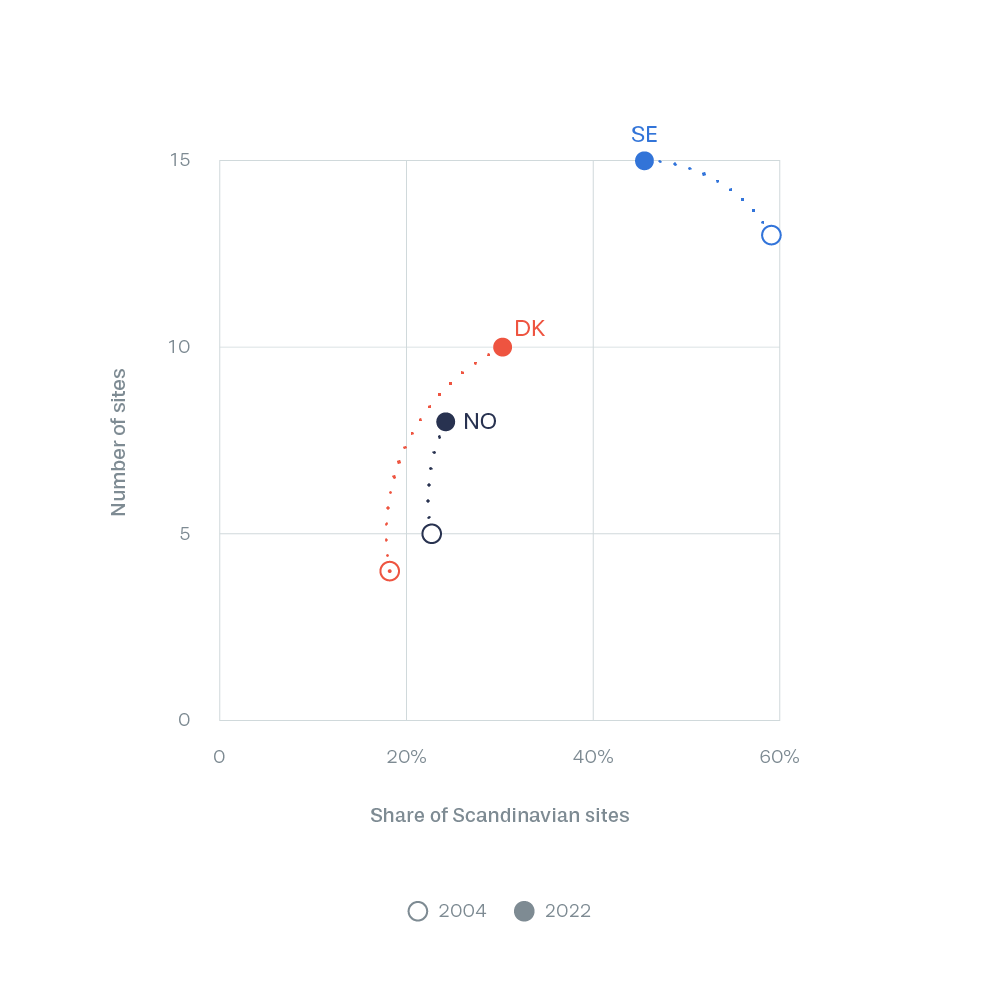
A scatter plot combining the share of World Heritage sites with the absolute number of sites. The development from 2004 to present is included as a second dot. So the movement of both percentage share and absolute numbers are visible in the data visualization.


