#73
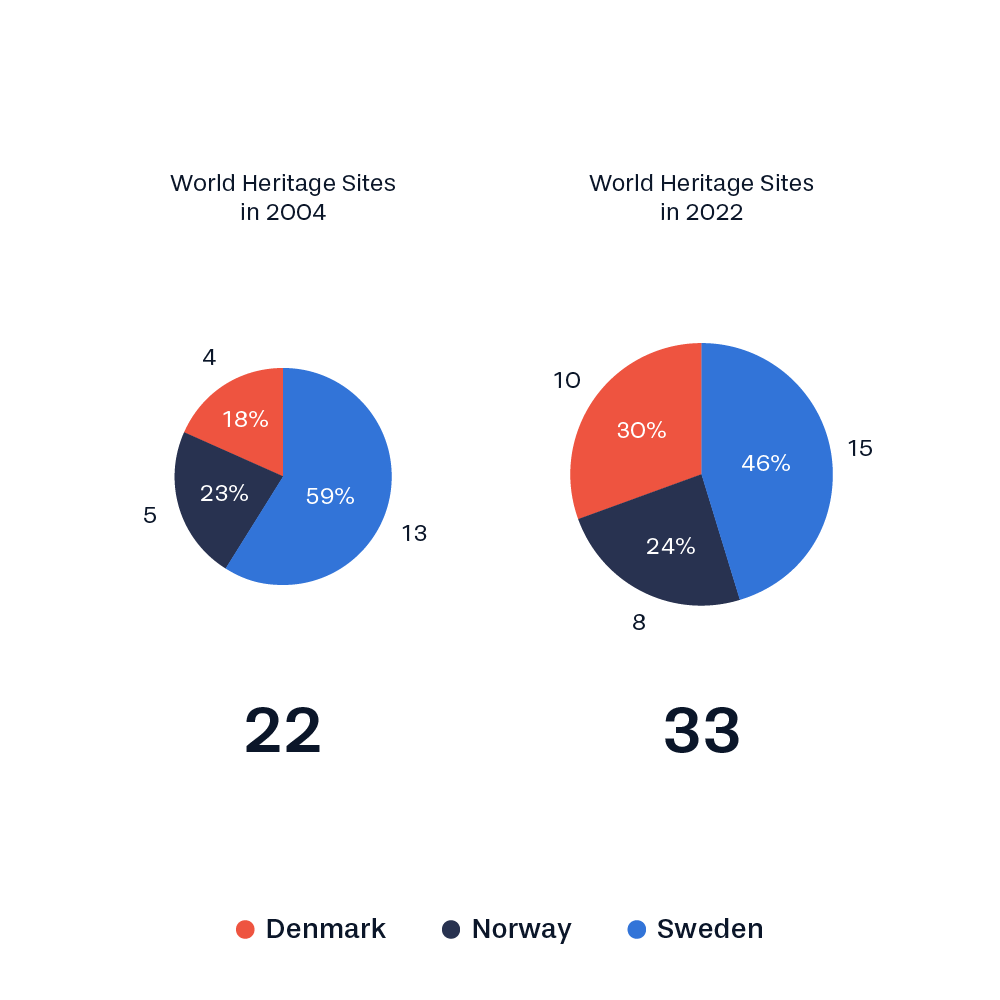
A compound chart combining the proportional area chart with pie charts. The proportional area chart compares the total number of World Heritage sites in Scandinavia in 2004 and 2022, while the pie charts compare the distribution in 2004 and now.

