#82
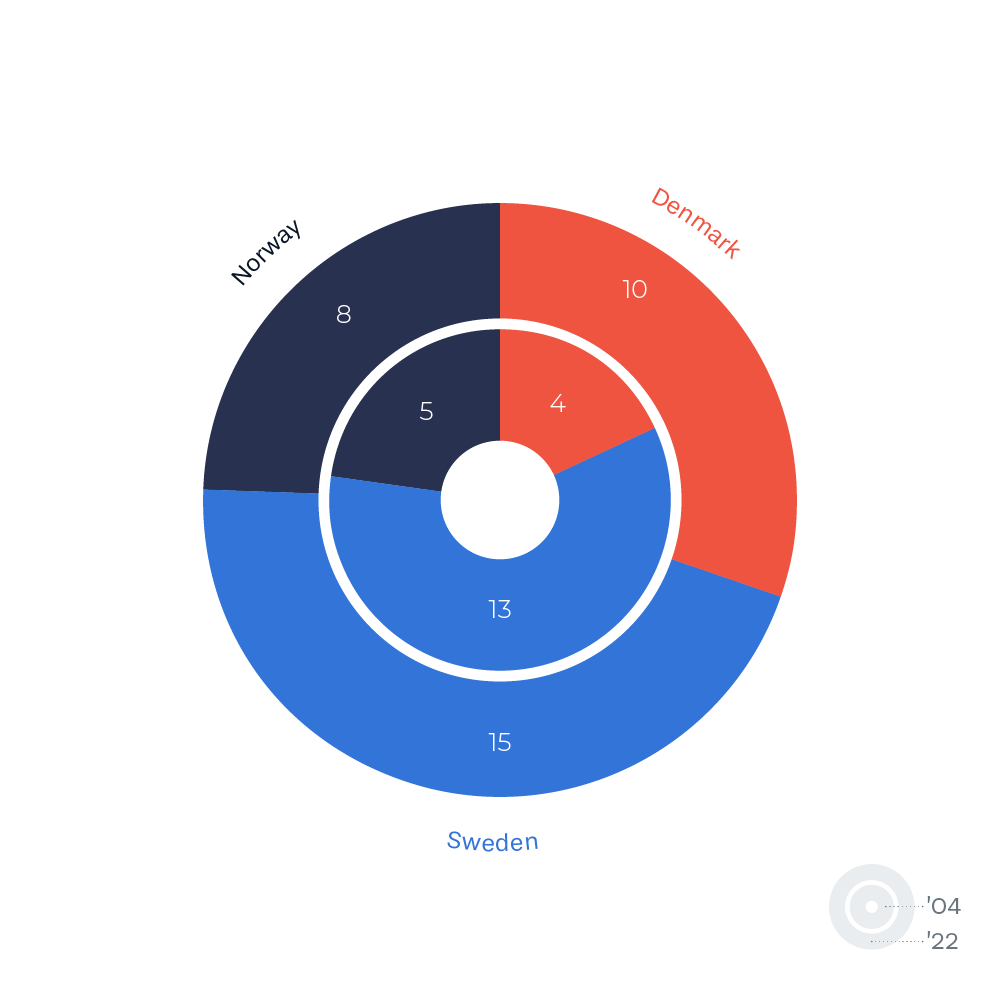
With this multi-level donut chart that aims to show the change in distribution of World Heritage sites. The inner donut is 2004 and the outer donut is 2022.
With this multi-level donut chart that aims to show the change in distribution of World Heritage sites. The inner donut is 2004 and the outer donut is 2022.

