#88
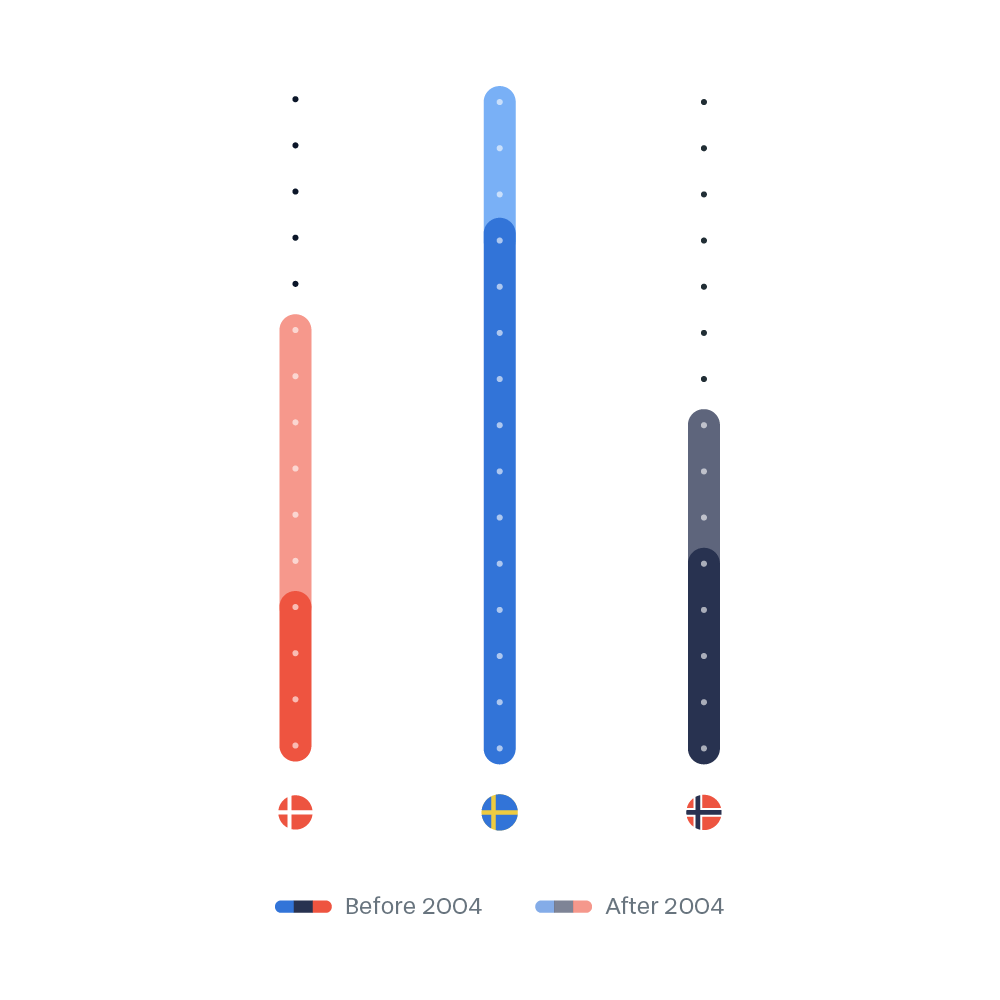
Stacked bar chart with an integrated scale of dots to make visual counting possible. Each dot represents a World Heritage site.
Stacked bar chart with an integrated scale of dots to make visual counting possible. Each dot represents a World Heritage site.

