#91
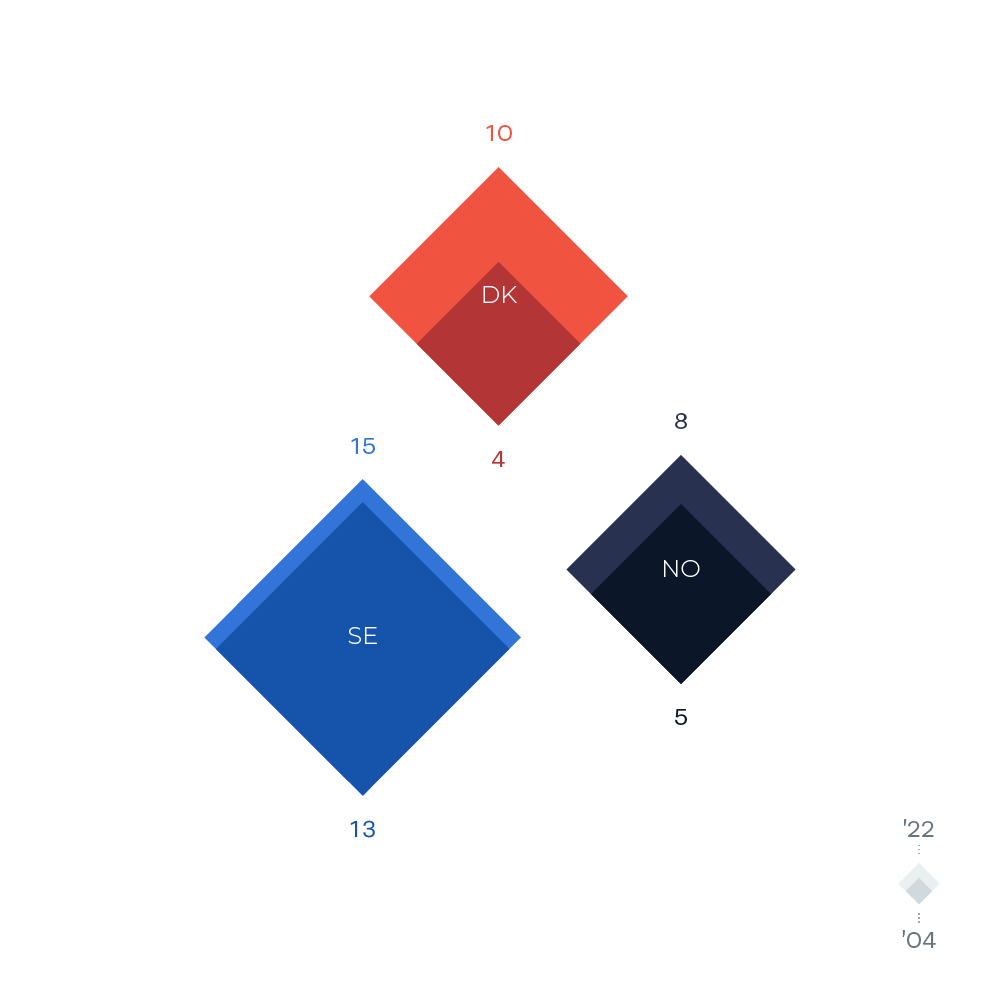
Perfect squares placed in 45 degrees formation are used as a nested proportional area chart. The inner square represents the 2004 values and the outer 2022 values.
Perfect squares placed in 45 degrees formation are used as a nested proportional area chart. The inner square represents the 2004 values and the outer 2022 values.

