#93
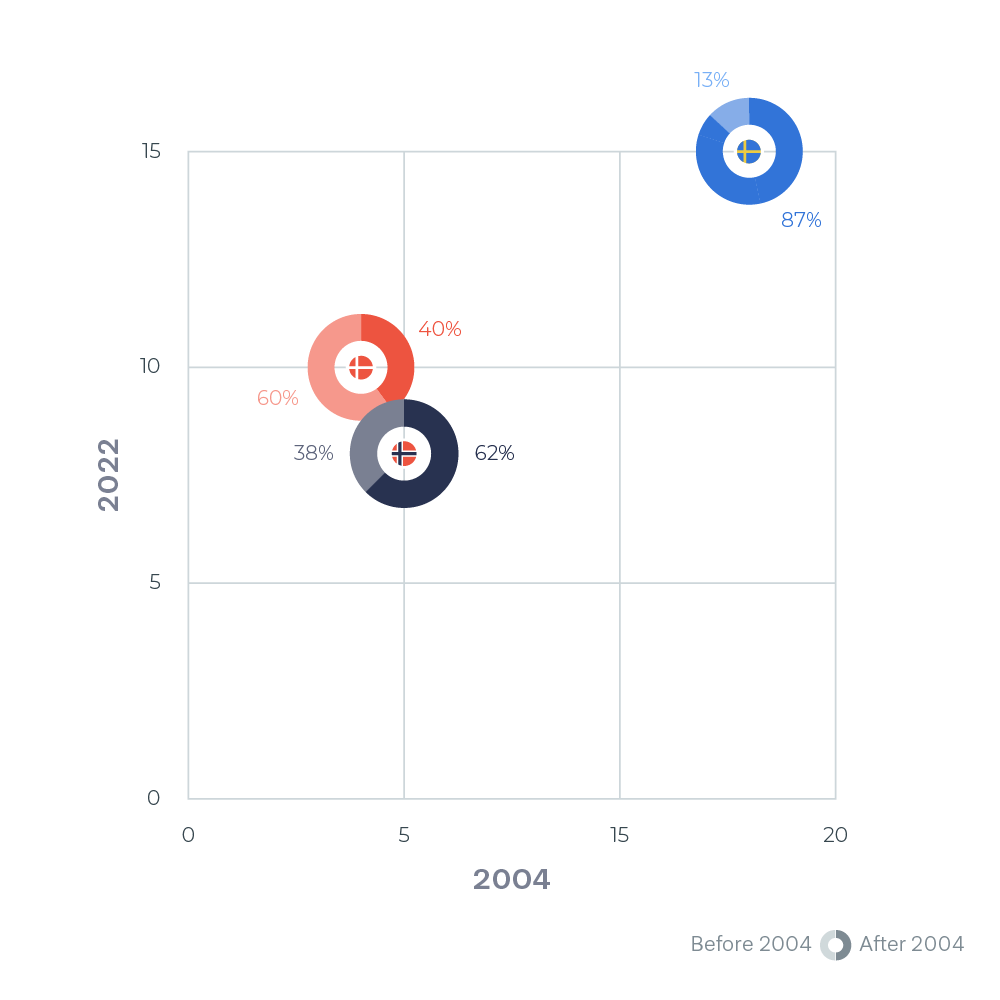
A compound chart combining a scatter plot and donut chart. The scatter plot includes the 2004 and 2022 data on each axis, whereas the donut chart shows the distribution between World Heritage sites before and after 2022 in percentages.
A compound chart combining a scatter plot and donut chart. The scatter plot includes the 2004 and 2022 data on each axis, whereas the donut chart shows the distribution between World Heritage sites before and after 2022 in percentages.


