#59
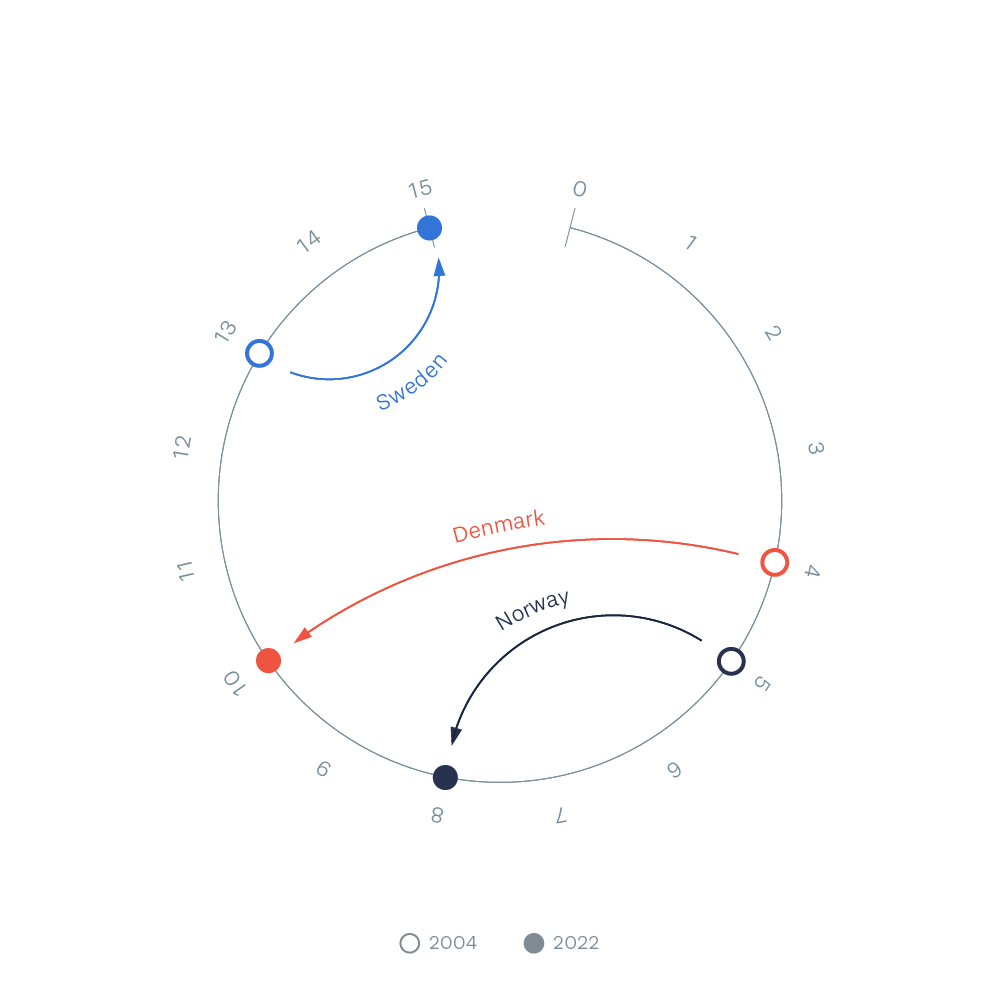
On a circular axis, the development from 2004 to 2022 is visualized as dots connected by arrows. In this case, the circular axis has no particular purpose per se, but it does make the visualization a bit more interesting.
On a circular axis, the development from 2004 to 2022 is visualized as dots connected by arrows. In this case, the circular axis has no particular purpose per se, but it does make the visualization a bit more interesting.


