#81
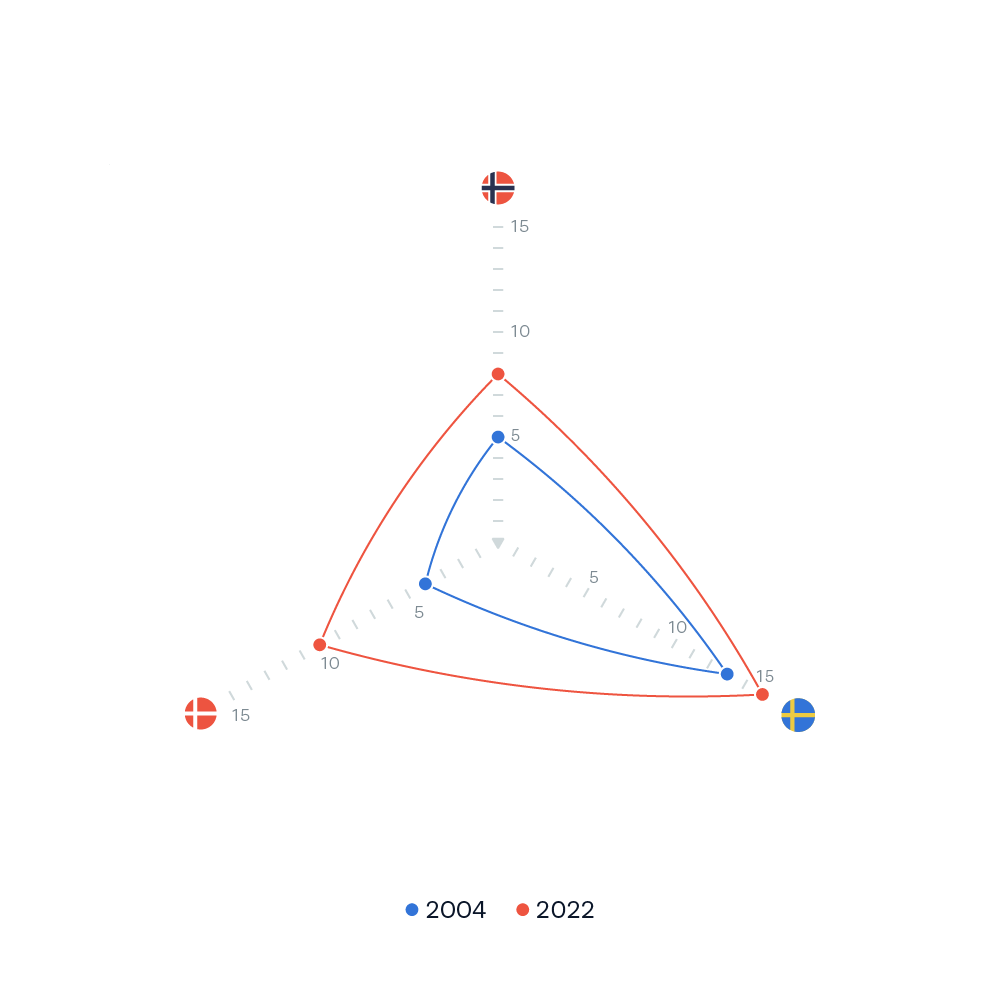
The data is visualized in a radar diagram consisting of the 3 countries and the two years as variables. The visualization highlights the fact that the number of World Heritage sites grew from 2004 to 2022 for all countries.
The data is visualized in a radar diagram consisting of the 3 countries and the two years as variables. The visualization highlights the fact that the number of World Heritage sites grew from 2004 to 2022 for all countries.


