#19
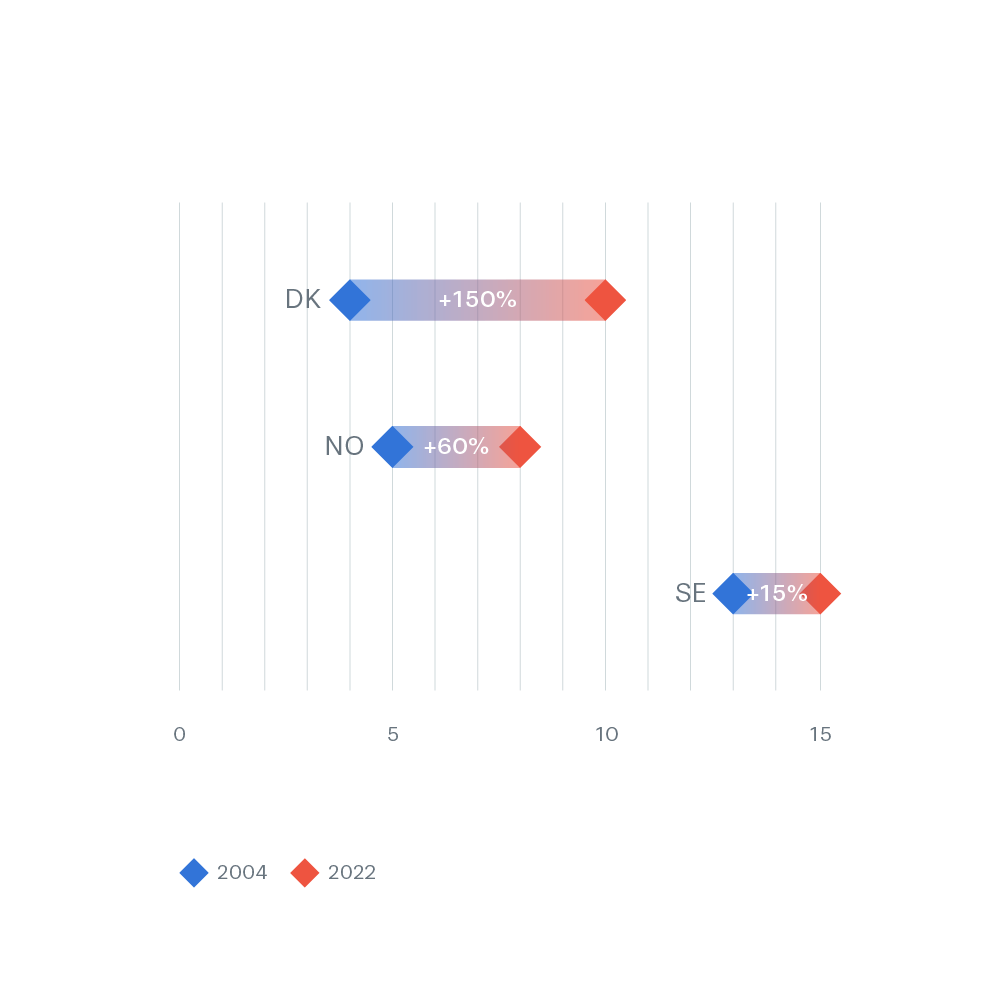
A dumbbell type of plot visualizing the changes in World Heritage sites from then to now. Furthermore, the percentile change is included as the most relevant parameter here.
A dumbbell type of plot visualizing the changes in World Heritage sites from then to now. Furthermore, the percentile change is included as the most relevant parameter here.


