#43
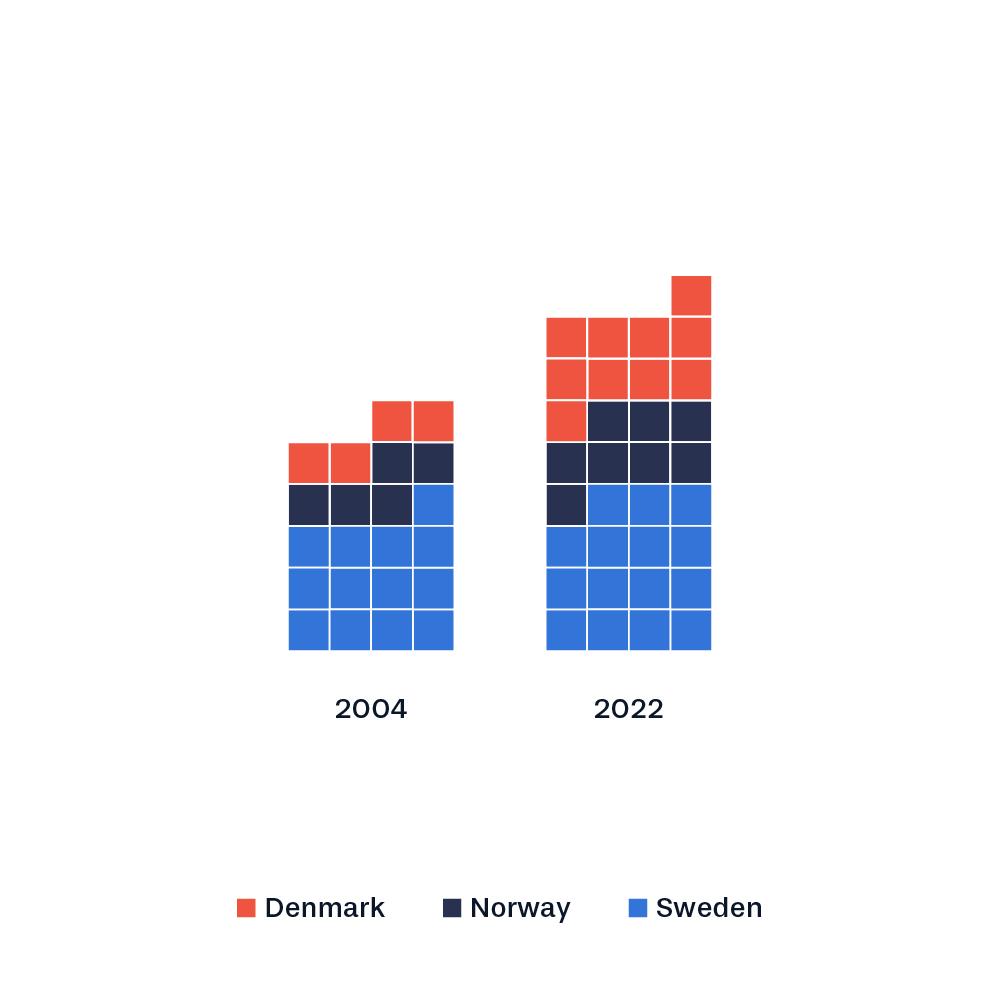
Visualization of squares for each Scandinavian World Heritage site. Also called a waffle chart. The main story here is the total numbers and the distribution of sites seem to be secondary.
Visualization of squares for each Scandinavian World Heritage site. Also called a waffle chart. The main story here is the total numbers and the distribution of sites seem to be secondary.

