#50
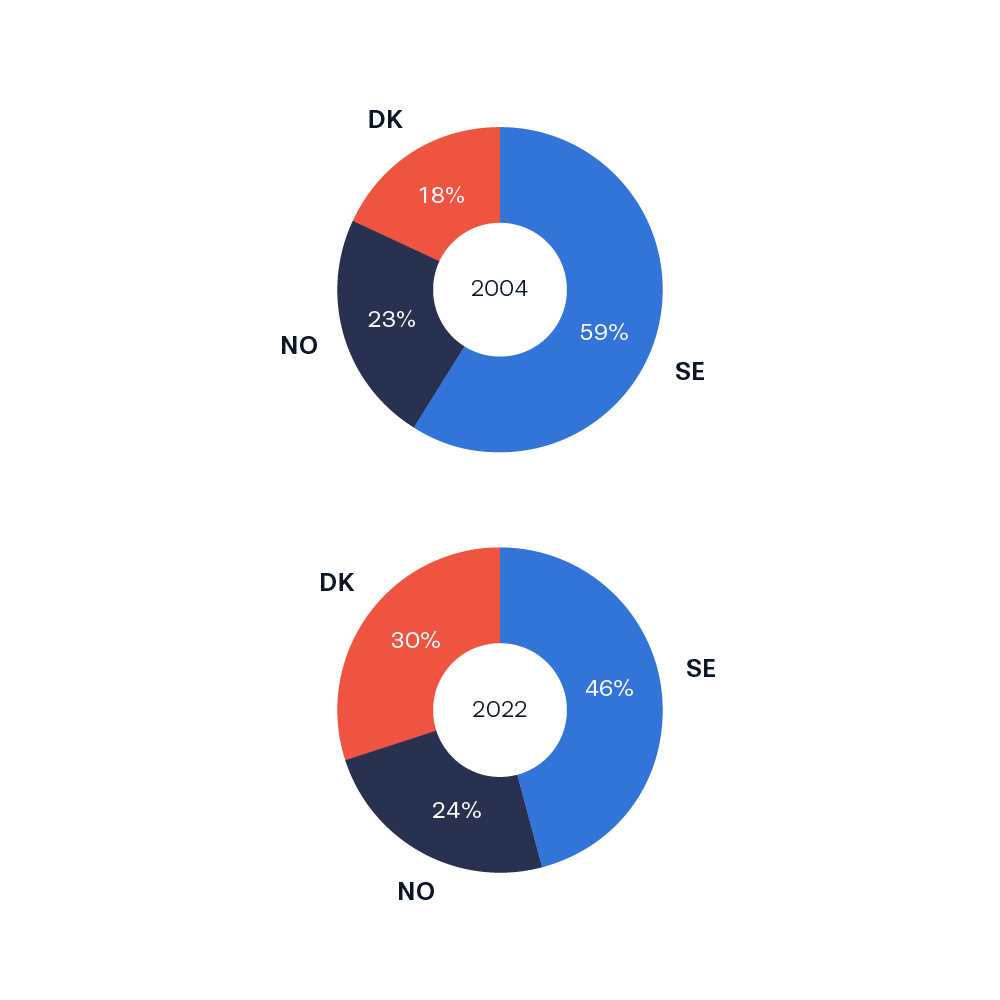
Donut charts depicting the distribution of World Heritage sites in 2004 and 2022. A donut chart is not the best way to show development as the length of the donut slices can be difficult to read.
Donut charts depicting the distribution of World Heritage sites in 2004 and 2022. A donut chart is not the best way to show development as the length of the donut slices can be difficult to read.

