#8

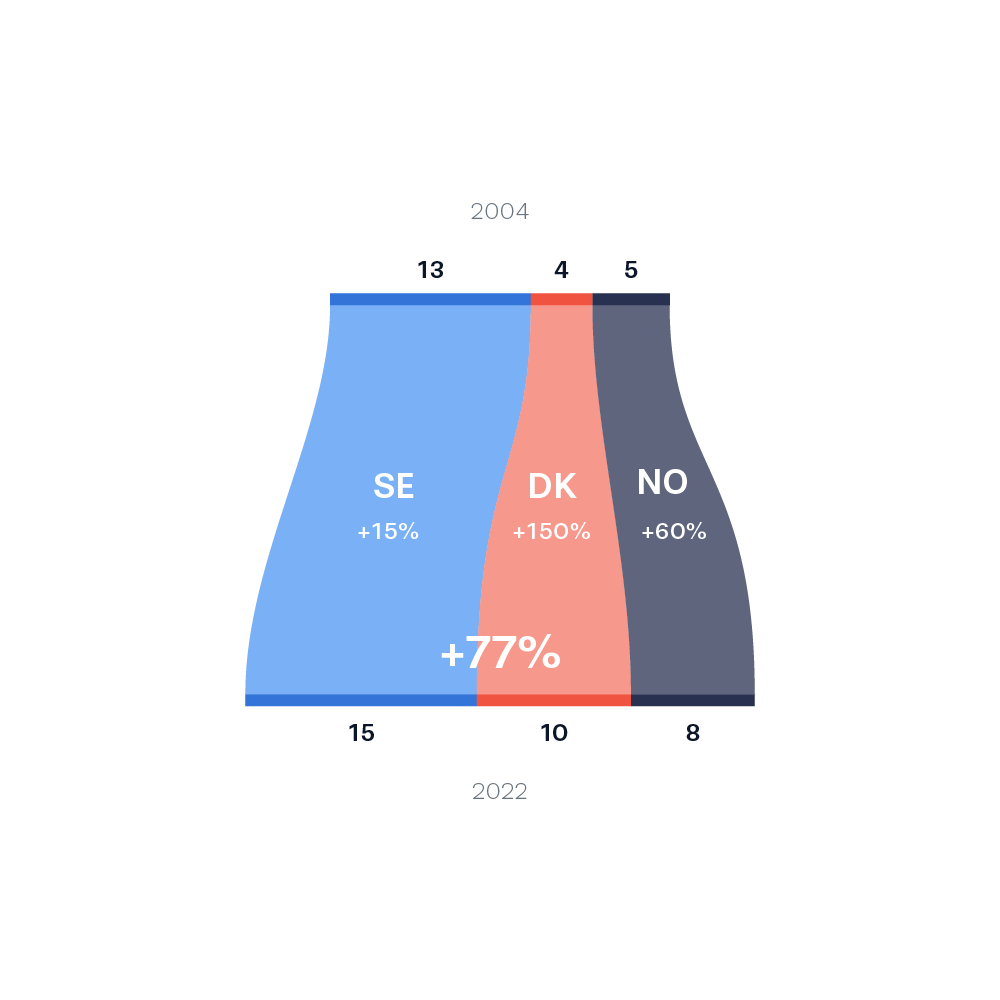
Stacked bar charts bridged visually, with perceptual change for both individual countries and total perceptual change for Scandinavia.

Stacked bar charts bridged visually, with perceptual change for both individual countries and total perceptual change for Scandinavia.