#9
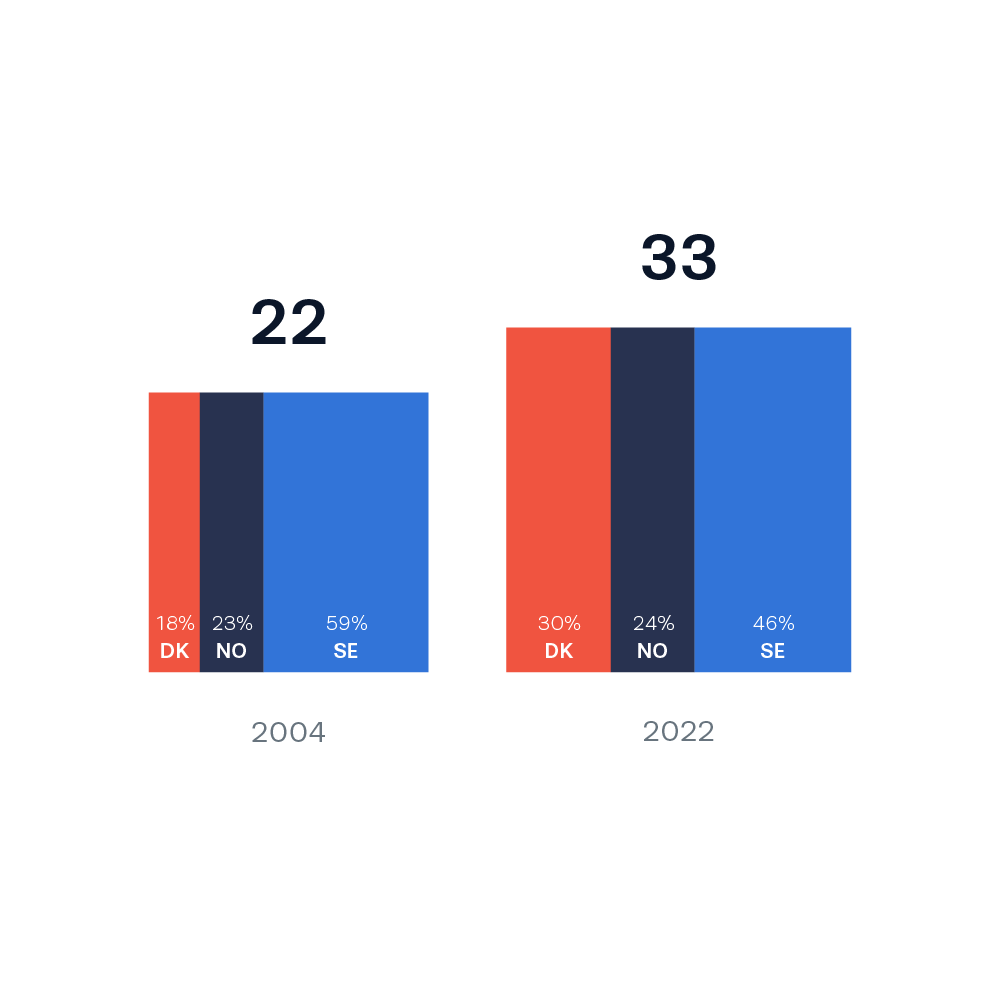
This data visualization combines a square area chart for the total Scandinavian progress and stacked bar charts showing the distribution between the countries in percentage.
This data visualization combines a square area chart for the total Scandinavian progress and stacked bar charts showing the distribution between the countries in percentage.


