#95
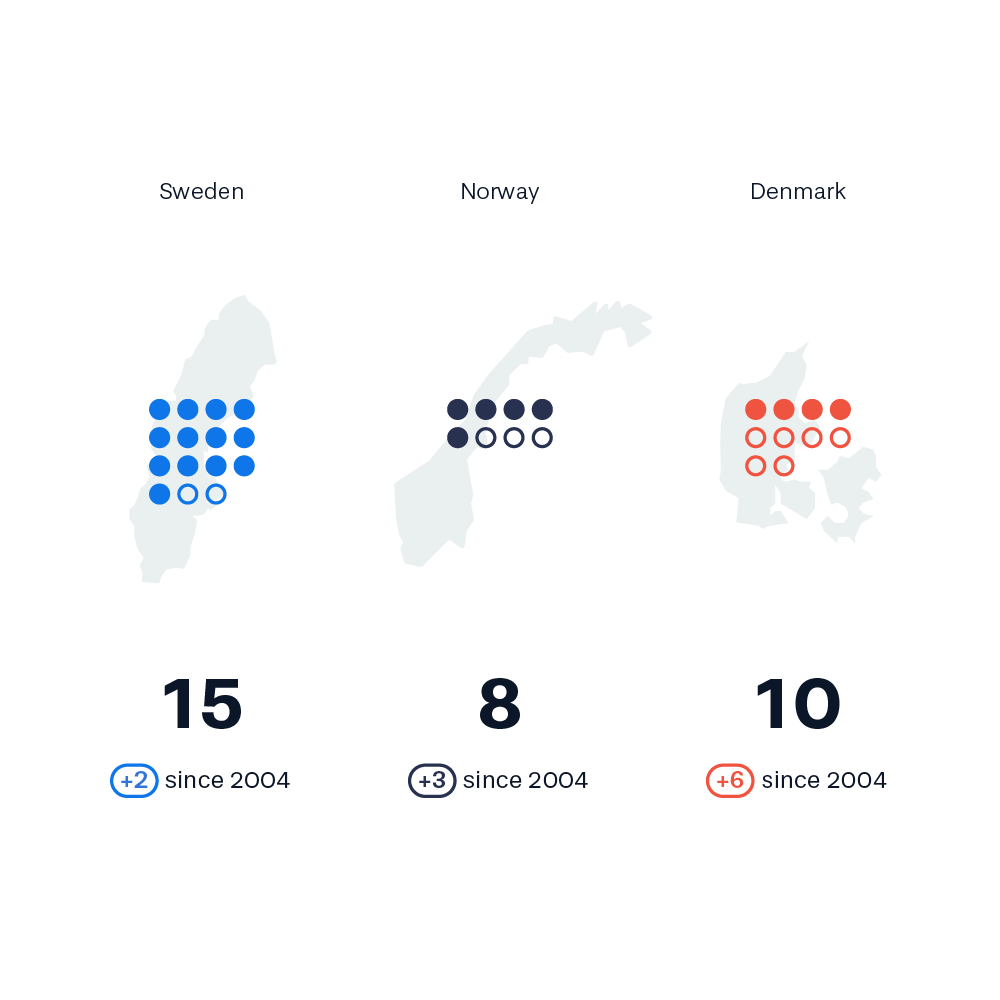
A dot plot combined with map icons for visual reference. The dots differentiate between World Heritage sites before and after 2004, and the rise in World Heritage sites is noted as a label.
A dot plot combined with map icons for visual reference. The dots differentiate between World Heritage sites before and after 2004, and the rise in World Heritage sites is noted as a label.

