Data Viz Project 1 dataset. 100 visualizations.

by Ferdio

  • All
  • Story
  • Property
  • Shape
  • About
  • Instagram
X
X
X
X

1 dataset 100 visualizations

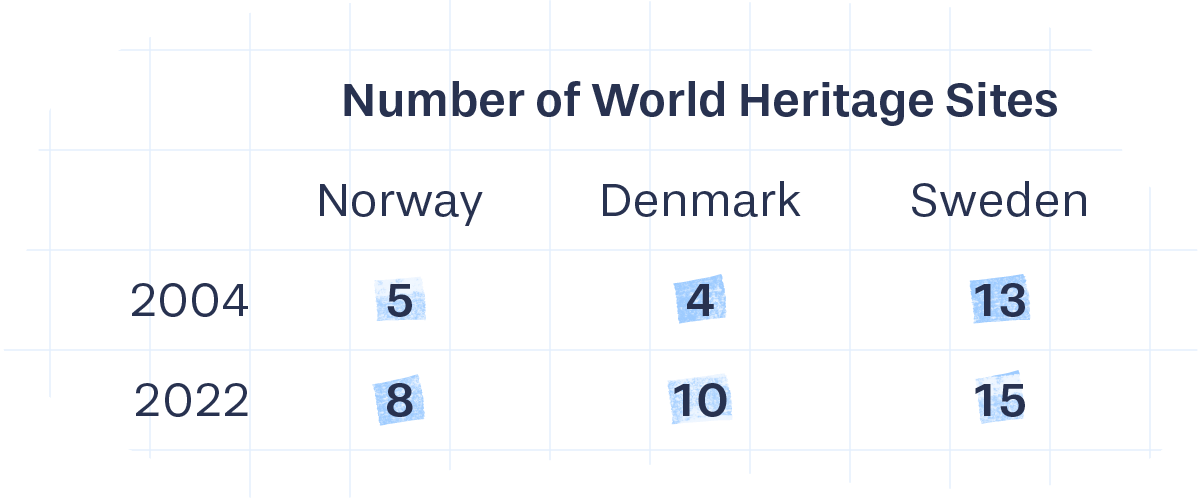
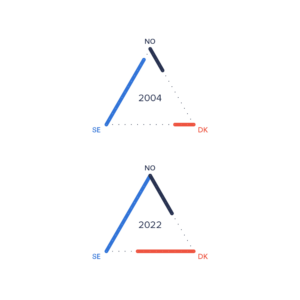
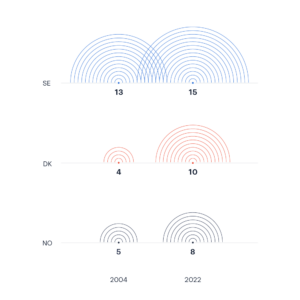
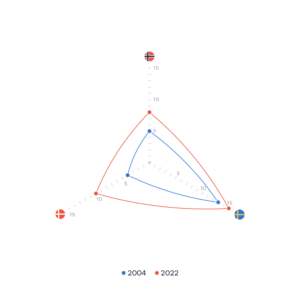
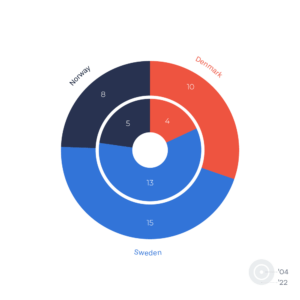
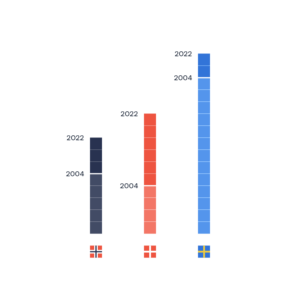
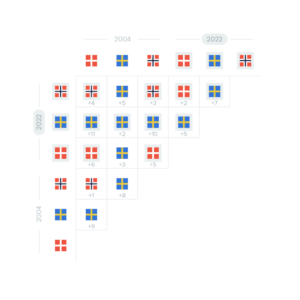
Can we come up with 100 visualizations from one simple dataset?

As an information design agency working with data visualization every day, we challenged ourselves to accomplish this using insightful and visually appealing visualizations.

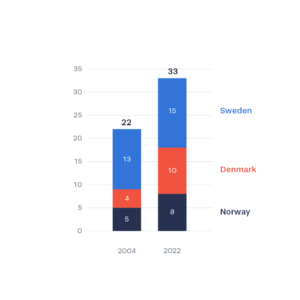
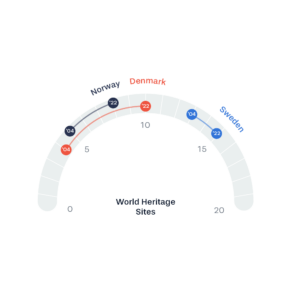
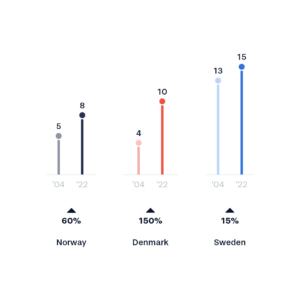
We wanted to show the diversity and complexity of data visualization and how we can tell different stories using limited visual properties and assets.

World Heritage Sites. Norway: 5 in 2004, 8 in 2022. Denmark: 4 in 2004, 10 in 2022. Sweden: 13 in 2004, 15 in 2022.

Learn more

#1

#2

#3

#4

#5

#6

#7

#8

#9

#10

#11

#12

#13

#14

#15

#16

#17

#18

#19

#20

#21

#22

#23

#24

#25

#26

#27

#28

#29

#30

#31

#32

#33

#34

#35

#36

#37

#38

#39

#40

#41

#42

#43

#44

#45

#46

#47

#48

#49

#50

#51

#52

#53

#54

#55

#56

#57

#58

#59

#60

#61

#62

#63

#64

#65

#66

#67

#68

#69

#70

#71

#72

#73

#74

#75

#76

#77

#78

#79

#80

#81

#82

#83

#84

#85

#86

#87

#88

#89

#90

#91

#92

#93

#94

#95

#96

#97

#98

#99

#100

Hire us

We can visualize your own story

Ferdio is a leading infographic and data visualization agency specialized in transforming data and information into captivating visuals. Ferdio applies unique competencies of creativity, insight and experience throughout every project with a wide range of services.

Get in touch